
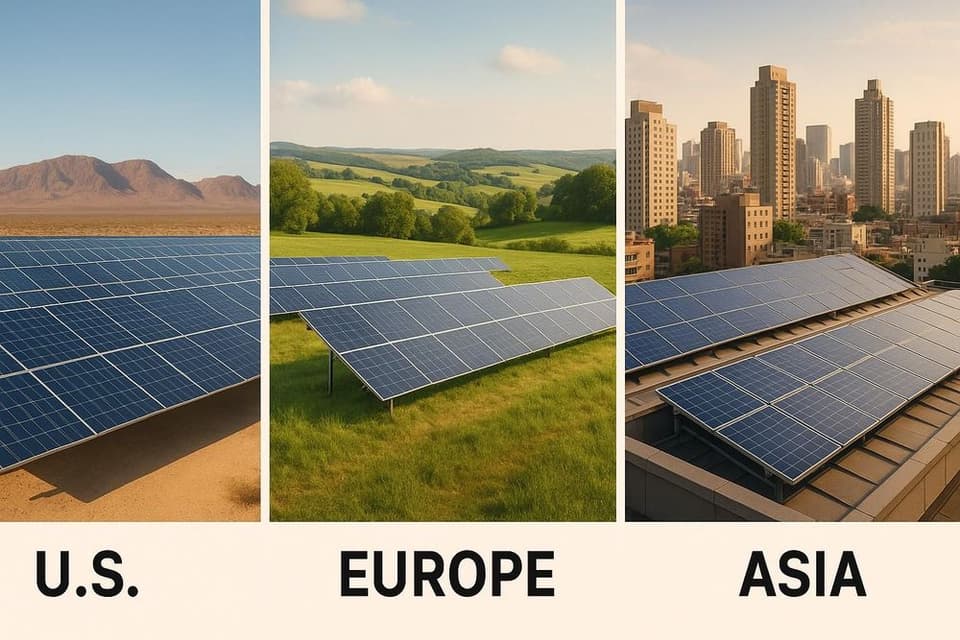
Solar energy financing is not one-size-fits-all. Different regions rely on unique methods to structure debt accounts, shaped by local risks, policies, and market conditions. Here's what you need to know:
- United States: Heavily relies on tax equity partnerships, leveraging federal tax benefits like the 30% Investment Tax Credit (ITC) and accelerated depreciation. These models fund 40%-70% of project costs but expose investors to policy risks.
- Europe: Focuses on standardized green bonds under the EU Green Bond Regulation, emphasizing transparency and environmental criteria. Debt costs are lower, with Germany securing rates as low as 2.8%.
- Asia: Dominated by government-backed financing, including tax exemptions, revenue guarantees, and equity participation. Countries like China lead with state-driven initiatives, while India offers targeted subsidies.
Quick Comparison
| Region | Financing Model | Key Advantage | Primary Challenge |
|---|---|---|---|
| United States | Tax equity partnerships | Monetizes tax benefits | Policy unpredictability |
| Europe | Green bonds | Lower debt costs | Regulatory complexity |
| Asia | Government-backed financing | Stable cash flows from guarantees | Currency risk |
These regional approaches directly influence the cost, risks, and feasibility of solar projects. Whether you're navigating tax equity in the U.S., green bonds in Europe, or government-backed programs in Asia, understanding these differences is critical to success.
Renewable Energy Investment Structuring in US
1. U.S. Solar Tax Equity Models
Solar financing in the U.S. heavily depends on tax equity partnerships, which help monetize federal tax benefits. These partnerships supported deals worth $4.5 billion in 2014 for solar projects alone. Below is an overview of the tax benefits and partnership structures that form the backbone of these models.
The structure revolves around two key tax incentives:
- 30% Investment Tax Credit (ITC)
- Accelerated depreciation, allowing 85% of project costs to be deducted over five years
Together, these incentives provide about 56 cents for every dollar of capital cost. These benefits drive the standard partnership arrangements outlined below.
| Partnership Structure Component | Typical Arrangement |
|---|---|
| Initial Tax Equity Share | 99% of income/losses |
| Post-Flip Sponsor Share | 95% ownership |
| Utility-Scale Project Yields | 7.25-8% (unleveraged) |
| Residential Project Yields | ~9% (brand-name developers) |
A defining feature of this model is the "flip structure", where ownership percentages change once investors reach their target returns. As Keith Martin, a partner at Norton Rose Fulbright, explains:
"The central tension in partnership flip transactions is whether the tax equity investor is truly a partner or is a lender or bare purchaser of tax benefits in substance. The latter two labels would prevent the investor from sharing in the tax benefits on the project."
To maximize efficiency while maintaining the tax equity structure, sponsors often use subordinated debt behind tax equity. Over time, tax equity yields have declined, but this has been balanced by additional fees and secondary yield targets. ITC pricing typically ranges from $1.27 to $1.28 per dollar. When debt is prioritized before tax equity, investors demand an extra yield premium of 5%.
Partnership flips generally fund 40% to 70% of a project's value, whereas sale-leasebacks can theoretically cover 100% of the fair market value. This flexibility allows financing to be tailored to each project's unique needs.
2. European Solar Bond Standards
The European Union has introduced a unified approach to solar debt financing through the EU Green Bond (EU GB) Regulation, which will take effect in late 2024. Unlike the tax equity structures used in the U.S., Europe's regulated bond standards provide a single framework for financing solar projects.
The regulation outlines strict criteria for issuers aiming to qualify for the EU GB label:
| Requirement Category | Key Elements |
|---|---|
| Taxonomy Alignment | Projects must show clear environmental benefits |
| Reporting Structure | Requires audited allocation and impact reports |
| External Review | Independent verification of compliance is mandatory |
| Flexibility Allowance | Up to 15% of funds can be allocated to non-taxonomy activities |
This framework emphasizes consistency and transparency in solar financing. Florence Devevey, Managing Director and Head of Sustainable Finance EMEA at S&P Global Ratings, highlights its purpose:
"The regulation is part of the EU's sustainable finance strategy, which is intended to direct investment towards sustainable activities that contribute to the EU's environmental and climate goals."
The euro has become the dominant currency for green bond issuances, reflecting the strong adoption of these standards across Europe.
Key Implementation Requirements
To qualify for EU GB financing, developers must meet three main conditions:
- Environmental Contribution: Show that the project delivers clear environmental benefits.
- Harm Prevention: Ensure the activities funded do not harm other environmental objectives.
- Minimum Safeguards: Adhere to baseline safeguards outlined in the regulation.
This standardized approach has introduced stricter oversight mechanisms. As Christa Clapp, Global Head of Sustainable Finance Market Analytics at S&P Global Ratings, explains:
"The EU GB regulation, which requires audited allocation reports, for example, will introduce more standardisation."
However, applying these standards to international projects can be challenging. Since the framework is rooted in EU-specific regulations and directives, adapting it to solar projects outside Europe can be complex. The European Securities and Markets Authority (ESMA) also plays a role by supervising external reviewers of green bonds.
3. Asian Government-Backed Solar Finance
Asian markets approach solar financing differently than the U.S. and Europe, relying heavily on government involvement through specialized institutions and targeted incentives.
State-Backed Financial Infrastructure
Governments in Asia have created integrated systems that combine direct funding with measures to reduce risks. These systems typically include:
| Support Mechanism | Implementation Approach | Market Impact |
|---|---|---|
| Tax Exemptions | Project-specific relief | Lowers operational costs |
| Revenue Guarantees | Government-backed power purchase agreements (PPAs) | Provides stable cash flows |
| Equity Participation | Direct state investment | Boosts project credibility |
| Specialized Intermediaries | Infrastructure Development Finance Companies | Attracts private lenders |
Market Leadership and Growth
China leads the way in Asian solar finance, with impressive growth metrics. By 2021, its installed renewable energy capacity hit 1,063 gigawatts, accounting for 44.8% of its total power generation capacity. This growth reflects the success of government-supported frameworks in reducing financing risks.
Government Support Models
India's Dabhol Power Project is a prime example of effective government intervention through subsidies and public-private partnership (PPP) financing. Here's how the government made it work:
- Strategic Partnership Formation The Government of India and the Ministry of Power collaborated with private investors and public agencies via a special purpose vehicle (SPV).
- Risk Allocation Framework State institutions absorbed specific project risks, making investments more appealing to private lenders and lowering the overall cost of capital.
Financing Innovation
Asian markets continue to develop innovative financing methods, often diverging from Western models. For example, China relies on large state-owned enterprises to spearhead solar project deployments. In 2020, photovoltaic power generation accounted for 52.8% of all new global installations.
Future Development Framework
Asian governments are expanding their support mechanisms to meet ambitious renewable energy goals. China plans to increase renewable energy's share in its energy mix to nearly 37% by 2035 and 58% by 2050. This long-term vision offers stability for financing structures and encourages international investment in the sector.
Model Comparison
This section breaks down and compares key financing metrics across regions, focusing on differences in cost, risk, and market access strategies.
Cost Structure Analysis
The cost of financing solar projects varies significantly by region. European markets, particularly Germany, benefit from lower debt costs. For instance, German solar projects secure debt at 2.8%, while the U.S. and India face higher rates of 5.3% and 11.4%, respectively. These variations directly influence project feasibility and required equity returns:
| Region | Cost of Debt | Required Equity Return | Typical Debt Tenor |
|---|---|---|---|
| Germany | 2.8% | 8.3% | 15–20 years |
| United States | 5.3% | 10.3% | 12–15 years |
| India | 11.4% | 17.2% | 20–25 years |
These disparities shape the choice of investment vehicles and financing strategies across regions.
Market Access and Investment Vehicles
Each region employs financing tools tailored to its market conditions. In the U.S., securitization has seen major growth, with asset-backed securities (ABS) issuances reaching $1.2 billion in 2023. A notable example is SolarCity's $400 million ABS issuance, which achieved a 4.75% coupon rate, backed by 22,000 residential leases.
European markets focus on green bonds, emphasizing standardization. The European Investment Bank issued a €500 million solar bond in 2024 with a 3.2% yield, demonstrating how EU Taxonomy standards have lowered financing costs. These tailored instruments reflect differing approaches to managing risks, as outlined below.
Risk Allocation Framework
Regions adopt distinct methods for handling risks in solar financing:
- U.S. Model: Relies heavily on tax benefits but exposes investors to state-level policy risks. Securitization's share of the market grew from 8% in 2020 to 18% by 2024.
- European Model: Green bond standards have cut financing costs by 150 basis points since 2021, offering a balanced risk profile.
- Asian Model: Focuses on government support, with development banks playing a larger role. For example, India's PM-KUSUM program mobilized $12 billion through government-backed solar loans for farmers.
These approaches highlight how regions balance cost, market access, and risk differently, aligning with their unique market dynamics and policy frameworks.
Conclusion
Examining global solar financing structures highlights how regional strategies shape investment decisions through risk management, market access, and regulatory frameworks. Here's a quick breakdown of regional characteristics:
| Region | Key Advantage | Primary Challenge | Summary Attribute |
|---|---|---|---|
| Europe | Standardized Solar Bonds | Changing regulatory demands | EU Taxonomy Standards |
| United States | Strong tax equity market | Policy unpredictability | Portfolio diversification |
| Asia | Government-backed financing | Currency risk | Transitional FX debt platforms |
Institutional investors are increasingly outpacing traditional banks, having mobilized over €100 billion in European syndicated loans from 2013 to 2019. This shift reflects the evolving landscape of solar project financing.
One standout innovation is the Transitional FX Debt Platform, which uses donor grant capital to attract $17–$34 in foreign debt for every dollar invested. These tools illustrate how local conditions influence financing strategies, as previously detailed.
"A key principle in project finance is that risks must be allocated to creditworthy parties capable of mitigating them." - Project Finance for Solar Projects
The European Union estimates it will need €180 billion annually to achieve its climate goals. As these financing structures evolve, the focus will likely remain on balancing standardization with the adaptability required to address challenges like currency and regulatory risks, particularly in emerging markets.
FAQs
How do tax equity partnerships in the U.S. affect the risks and returns for solar energy investors?
In the U.S., tax equity partnerships, such as the partnership flip structure, play a key role in shaping the risks and returns for solar energy investors. These partnerships allow tax equity investors to initially receive the majority of taxable income and losses (often 99%) until a target return is achieved. After this point, their share decreases, and the project sponsor may have the option to buy out the investor's interest.
The investor's return is closely tied to the project's performance, meaning that factors like energy production and tax credit utilization directly influence the risk profile. The timing of the flip and the agreed-upon target yield are critical considerations for both investors and solar companies, as they determine the financial outcomes for all parties involved.
What challenges do European solar developers face when applying EU Green Bond standards to international projects?
European solar developers often encounter difficulties when adapting EU Green Bond standards to projects outside of Europe. These standards are heavily influenced by the EU Taxonomy, which is rooted in European regulations and directives. This can create mismatches when trying to align with the legal, environmental, and financial frameworks of non-European markets.
Additionally, regional differences in energy policies, enforcement mechanisms, and sustainability criteria can complicate compliance. Developers must carefully navigate these variations to ensure projects meet both local requirements and EU Green Bond expectations, which can increase complexity and costs.
How do government-backed financing models in Asia help reduce currency risks for solar energy projects?
Government-backed financing models in Asia often mitigate currency risks by incorporating mechanisms such as currency hedging, subsidized interest rates, or loans denominated in local currencies. These approaches help stabilize project costs and protect investors from fluctuations in exchange rates.
Additionally, some governments offer guarantees or risk-sharing agreements to attract foreign investment while minimizing exposure to currency volatility. These strategies create a more predictable financial environment for solar energy projects, improving their overall viability and appeal to international investors.
Related posts
- Segmentation of Debt Obligations Market in Solar Energy: Commercial vs. Residential Sector
- Comparative Analysis of Investment Attractiveness of Leasing and Credit Agreement Portfolios in Solar Energy
- Legal Risks When Purchasing Cross-Border Debt Portfolios in the Energy Sector
- Regulatory Restrictions on Working with Debt Obligations in Solar Energy: International Review
